Overview
Analytics helps you measure the impact of your AI-generated content on sales performance. Track revenue, orders, and product performance to understand which content versions drive the best results.Analytics tracks sales data for products with published content. Orders are automatically linked to the content versions that were live at the time of purchase.
Accessing Analytics
Navigate to Analytics from the main menu to view comprehensive sales and content performance metrics.Plan Availability
- Free Plan: Limited to last 7 days of data
- Pro Plan: Full access to all date ranges and features
Understanding View Modes
Analytics offers two complementary views for analyzing your content performance.Product View (Recommended)
Best for: Revenue reporting, product performance analysis, accurate order counts The Product View shows deduplicated metrics by product:- Each order is counted exactly once per product
- Accurate revenue totals without duplication
- Perfect for understanding overall product performance
- Shows which products generate the most sales
- Reporting revenue to stakeholders
- Analyzing product performance
- Identifying top-selling products
- Getting accurate order counts
Field Version View
Best for: A/B testing, content version comparison, field-level analysis The Field Version View shows performance metrics per content version:- Orders may appear multiple times (once per field version)
- Compare how different versions of titles, descriptions, etc. perform
- Useful for testing which content drives better results
- Shows which field types contribute most to sales
- Comparing content versions (e.g., Description v1 vs v2)
- A/B testing different content approaches
- Analyzing which field types drive sales
- Understanding content performance at the field level
Date Range Selection
Selecting a Date Range
- Click the date range picker button at the top of the Analytics page
- Choose your start and end dates from the calendar
- Click “Apply” to update the analytics data
- Free Plan: Last 7 days (fixed, cannot be changed)
- Pro Plan: Last 30 days (customizable)
Comparison Mode
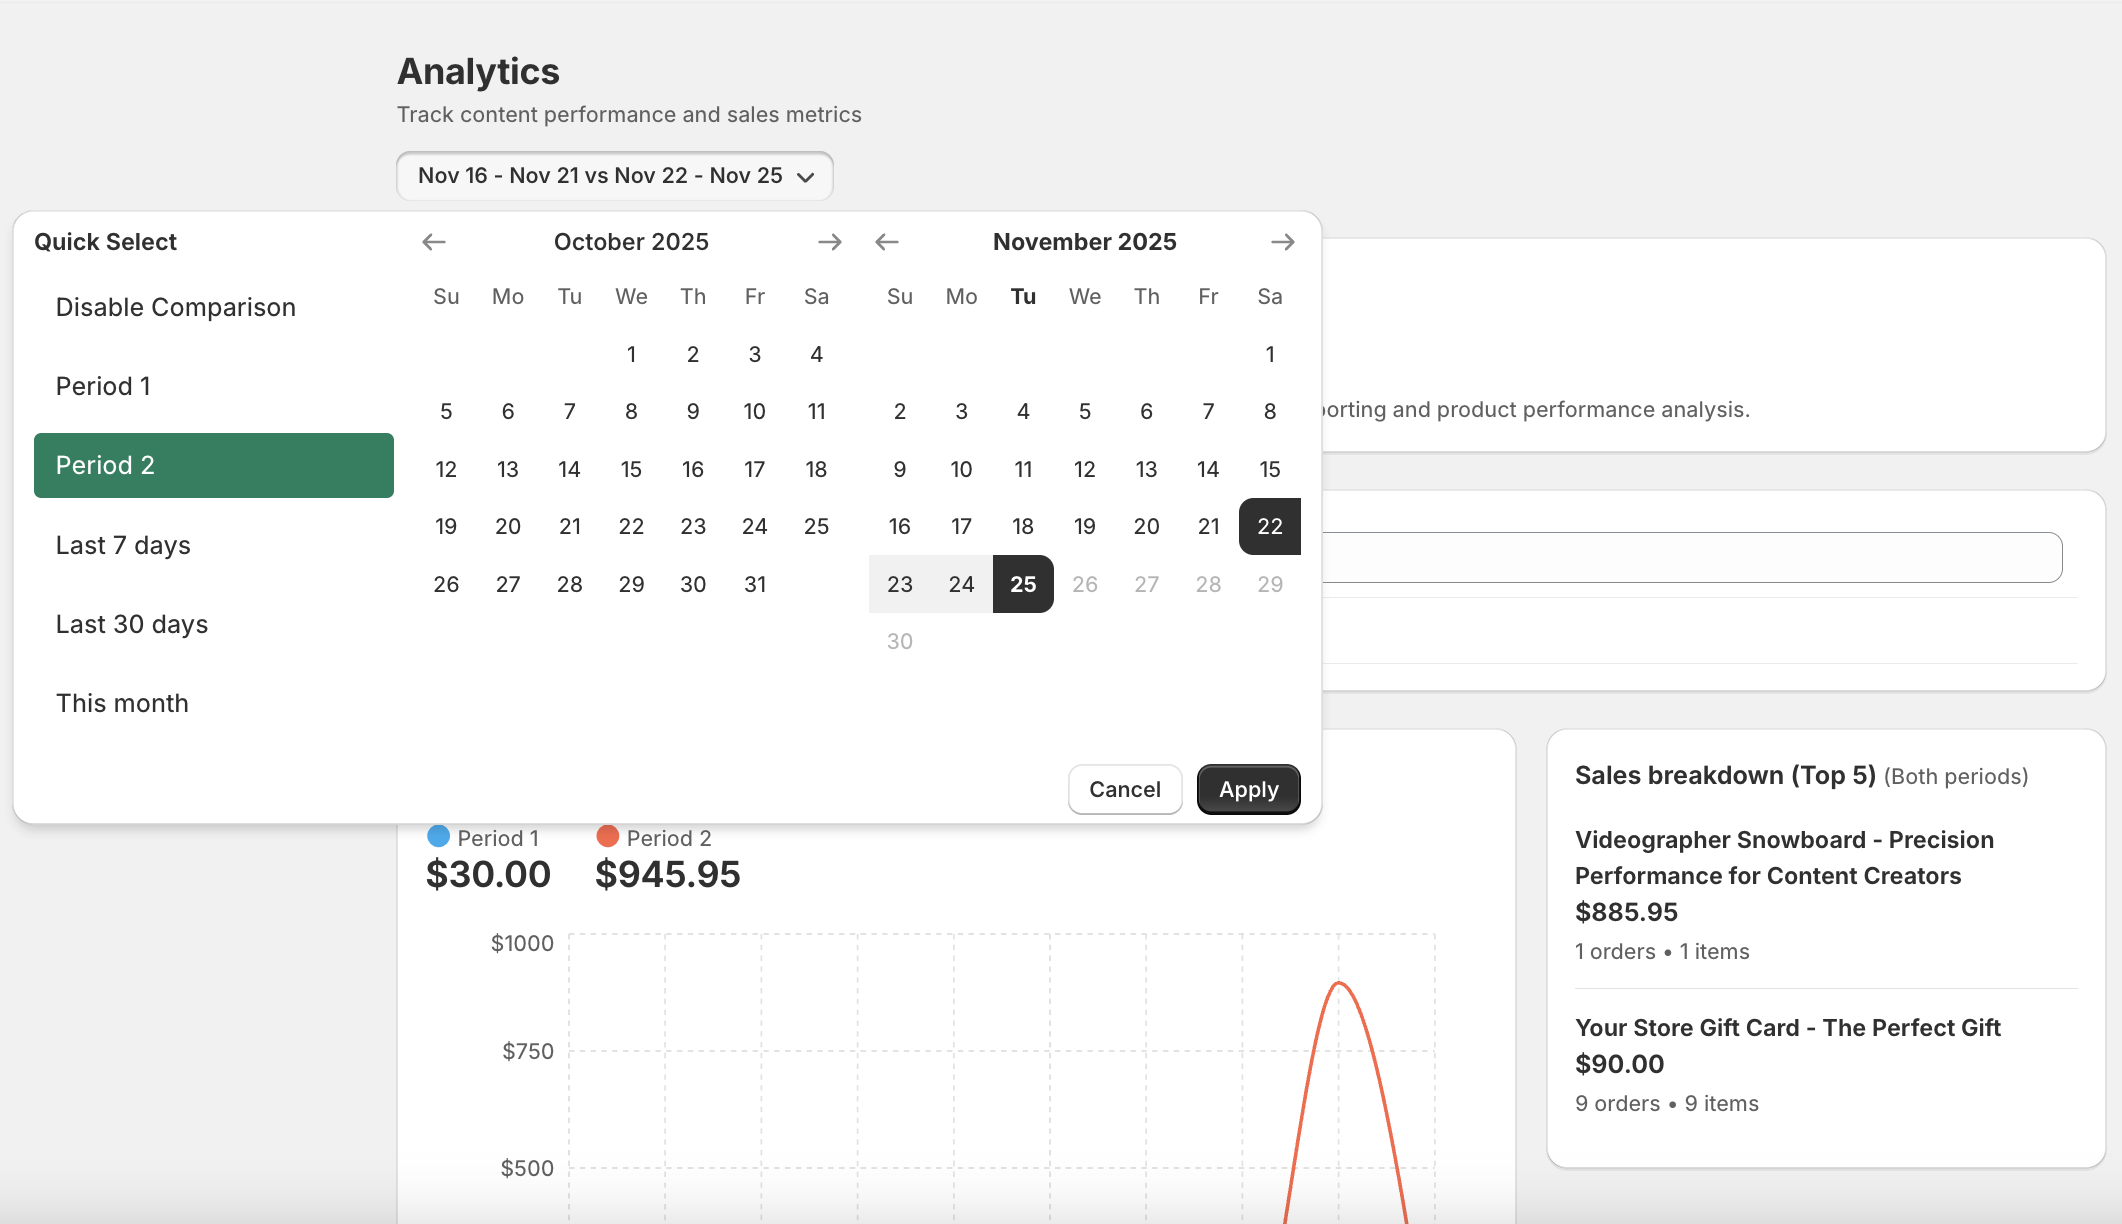 Compare performance across two different time periods:
- Enable “Comparison Mode” in the date picker
- Select your first date range (Period 1)
- Select your second date range (Period 2)
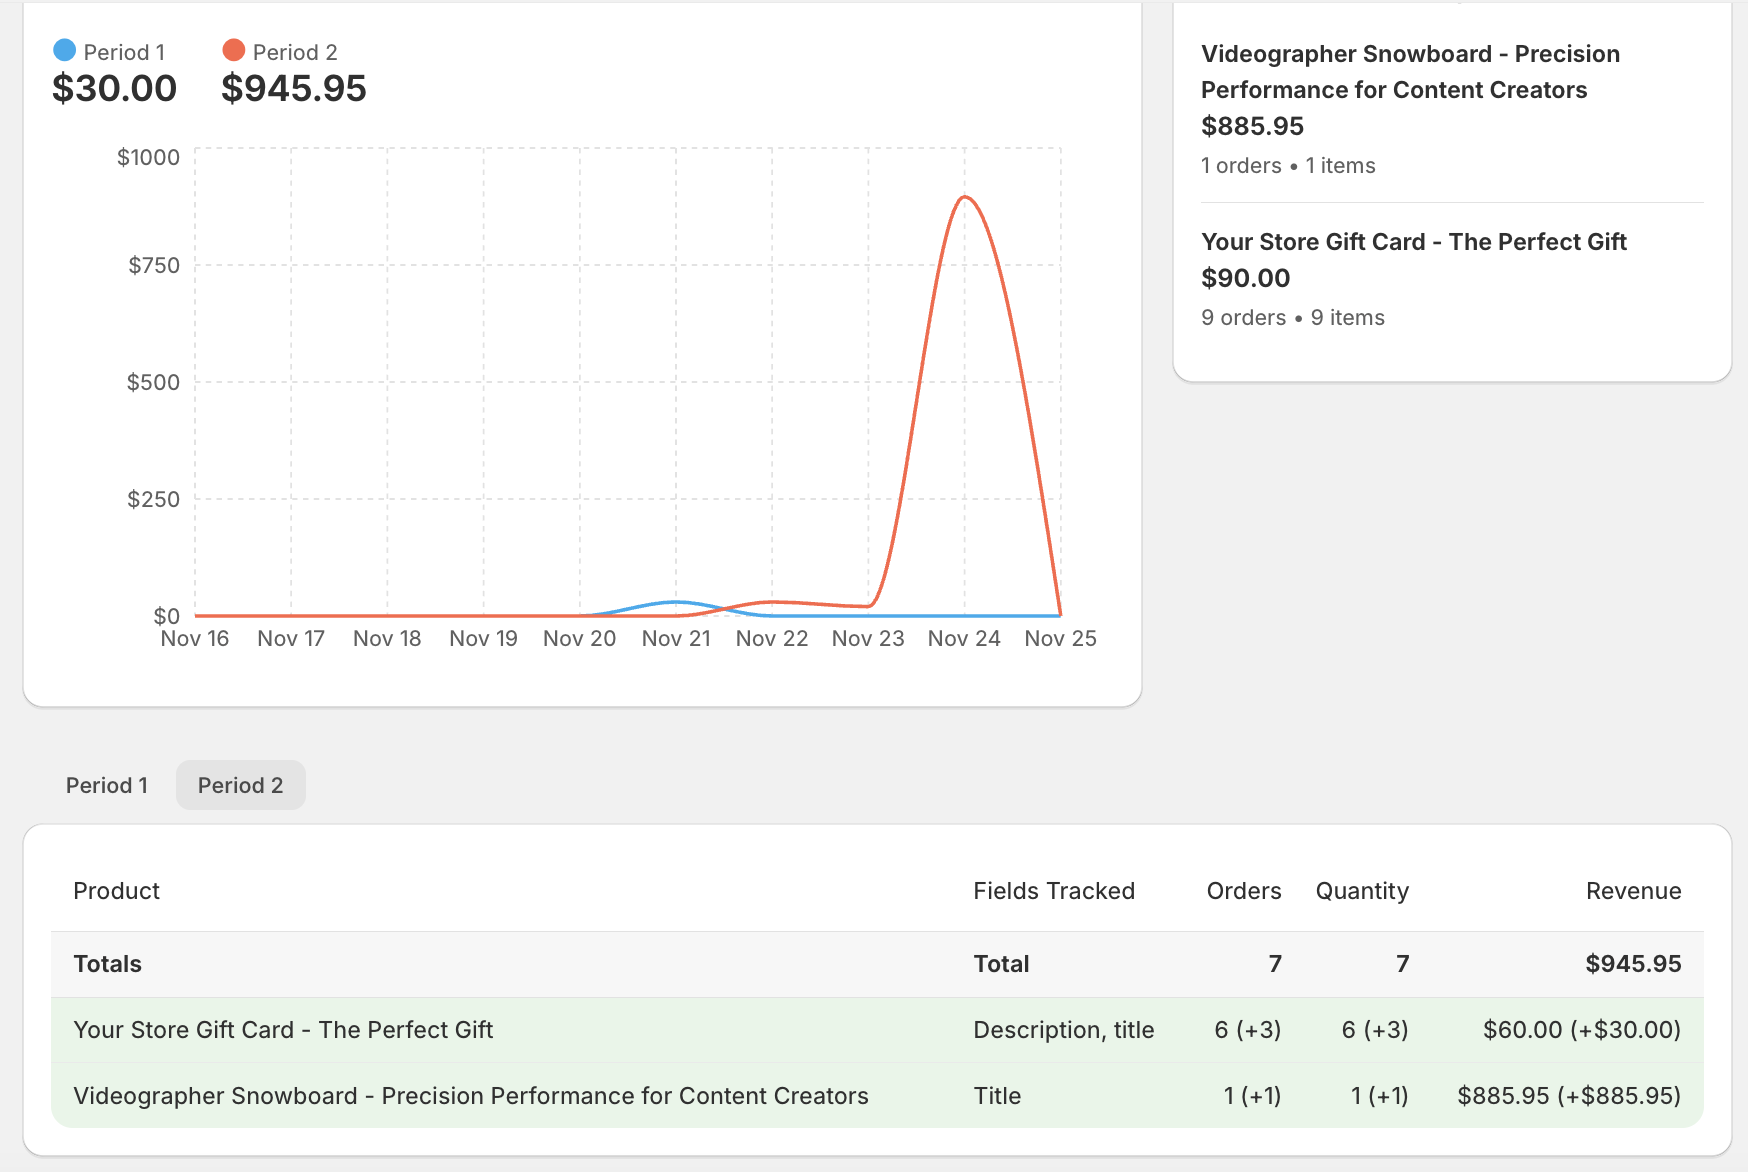
- View side-by-side comparison in charts and tables
- Compare this month vs last month
- Analyze seasonal trends
- Measure improvement over time
- Identify performance changes
Comparison mode is available on Pro plan only. Free plan users can view current period data only (last 7 days).
Sales Overview
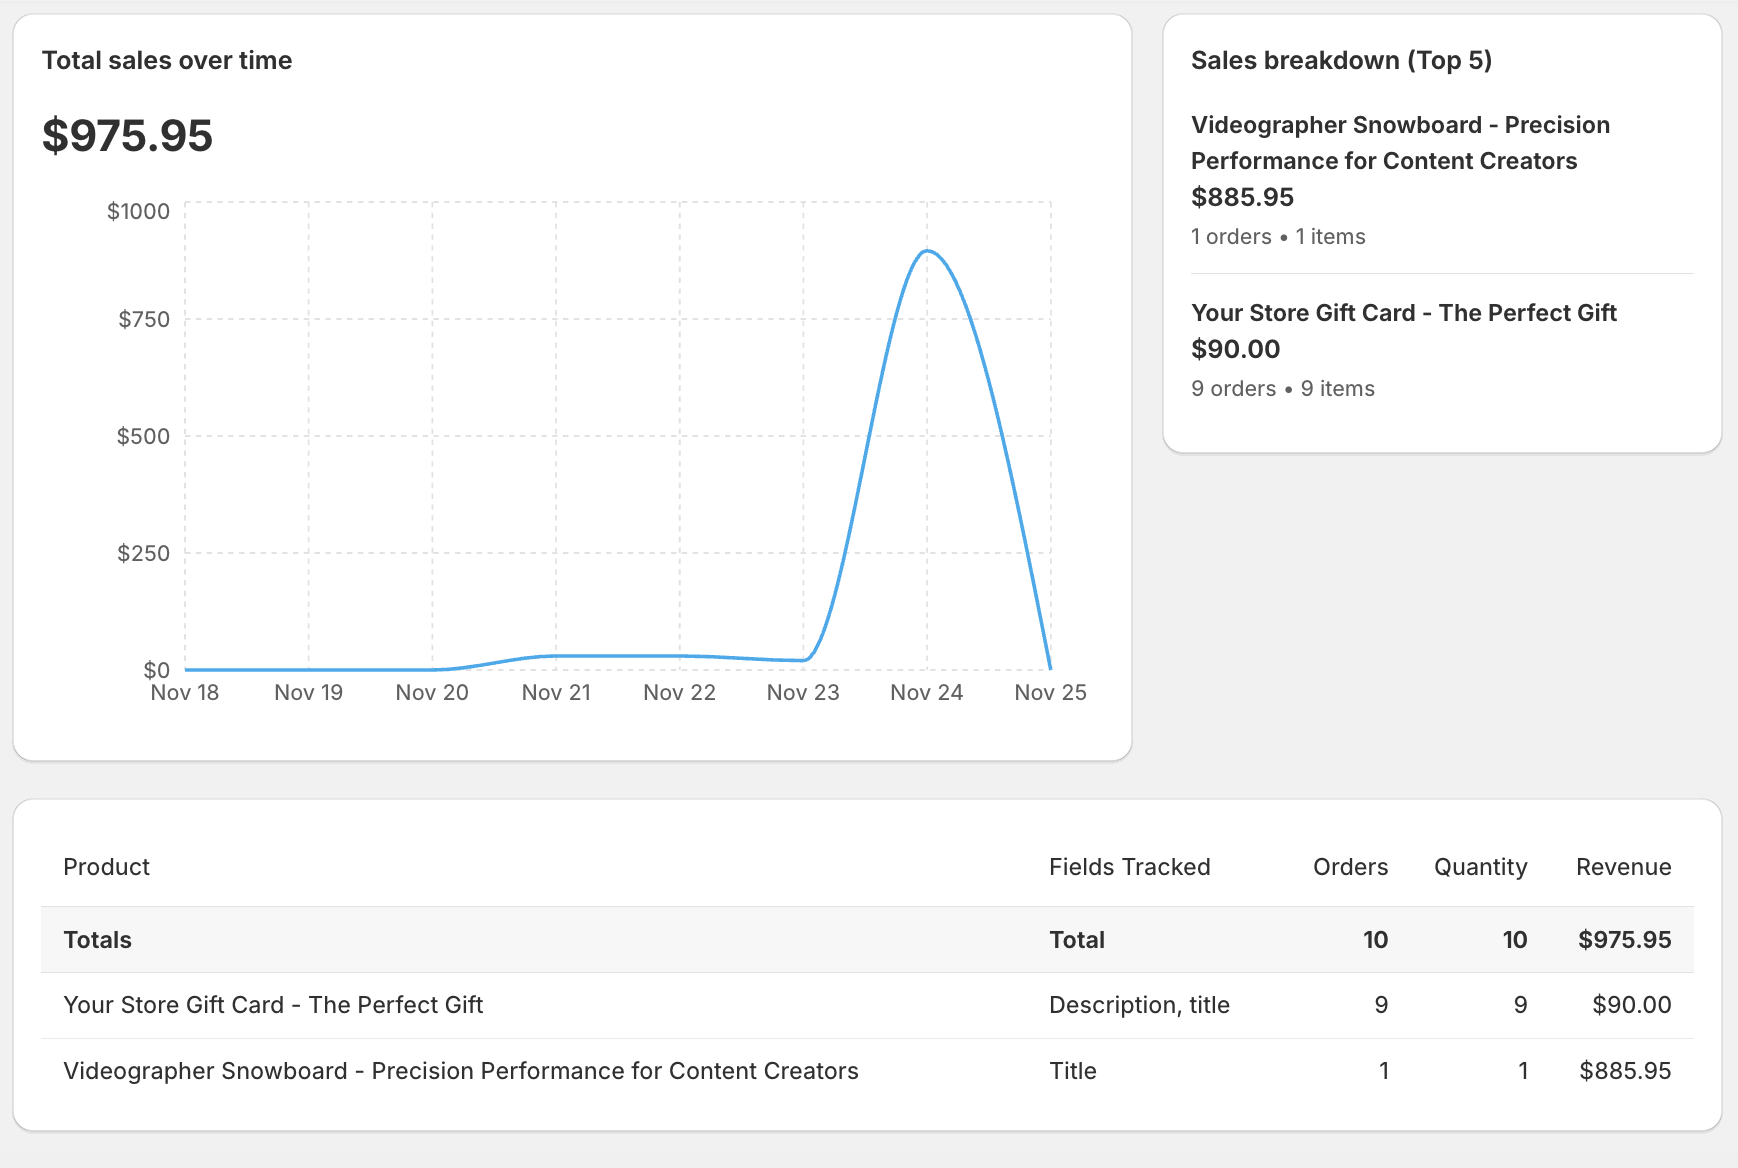
The Sales Overview section provides a high-level view of your performance metrics.Revenue Chart
The interactive chart shows revenue trends over time:- Daily view: See revenue per day
- Visual trends: Identify peaks and valleys
- Comparison mode: Overlay two periods for comparison
- Hover for details: See exact values for each data point
- Automatically adjusts scale based on date range
- Shows gaps for days with no sales
- Color-coded for easy comparison (when comparing periods)
Sales Breakdown Cards
Quick metrics at a glance: Total Revenue- Sum of all sales in the selected period
- Deduplicated in Product View
- Shows currency symbol
- Number of unique orders placed
- Accurate count (deduplicated in Product View)
- Reflects actual customer purchases
- Sum of all items sold
- Includes multiple quantities per order
- Useful for inventory planning
- Revenue divided by order count
- Helps understand customer spending patterns
- Useful for pricing strategy
In Field Version View, the breakdown cards show totals that may include the same order multiple times (once per field). The Product View shows accurate, deduplicated totals.
Analytics Table
The detailed table shows performance metrics for each product or field version.Table Columns
Product View columns:- Product Name: Name of the product
- Total Orders: Deduplicated order count
- Total Quantity: Items sold
- Total Revenue: Sales revenue
- Average Order Value: Revenue per order
- First Sale: Date of first sale in period
- Last Sale: Date of most recent sale
- Fields Tracked: Which content fields have versions
- Product Name: Name of the product
- Field: Content field type (title, description, etc.)
- Version: Content version number
- Total Orders: Orders for this specific version
- Total Quantity: Items sold with this version
- Total Revenue: Revenue attributed to this version
- Average Order Value: Revenue per order
- First Sale: Date of first sale with this version
- Last Sale: Date of most recent sale with this version
Table Totals
The bottom row shows:- Grand totals across all pages
- Accurate sums for revenue, orders, quantity
- Summary metrics for the entire filtered dataset
Interpreting Analytics Data
Understanding Metrics
Total Orders:- In Product View: Accurate count of unique orders
- In Field View: Count per field version (may duplicate orders)
- Higher is better, but consider average order value too
- Most important metric for business impact
- Product View shows accurate, deduplicated revenue
- Field View shows revenue per version (for comparison)
- Shows when sales occurred in your selected period
- Helps identify trends and patterns
- Useful for understanding sales velocity
Identifying Top Performers
Look for products/versions with:- High total revenue
- Consistent sales (recent last sale date)
- Good average order value
- Multiple orders (shows demand)
Identifying Underperformers
Products/versions that may need attention:- Low or zero orders
- Old last sale date (no recent activity)
- Low average order value
- Declining trend in comparison mode
Best Practices
Regular Monitoring
- Weekly reviews: Check analytics weekly to spot trends
- Monthly deep dives: Analyze monthly for strategic decisions
- After content changes: Review after publishing new content versions
Using Comparison Mode
- Compare this month vs last month regularly
- Analyze seasonal patterns (quarterly comparisons)
- Measure impact of content updates
- Track improvement over time
Filtering Strategy
- Start broad: View all products first
- Narrow down: Filter to specific products or fields
- Compare versions: Use Field View to test content variations
- Search for insights: Use search to find specific products quickly
Content Optimization
- Identify winners: Find top-performing content versions
- Learn from success: Understand what makes content effective
- Update underperformers: Improve low-performing products
- Test variations: Use Field View to compare versions
- Measure impact: Track improvements after updates